
number of visits: 0

 Add to favorites
Bitcoin and several altcoins are stuck in a tight range. This could be a sign that a failure is on its way.
BlackRock listed a bitcoin exchange-traded fund (ETF) on June 15. After this began a large part of the great Bitcoin rally case.
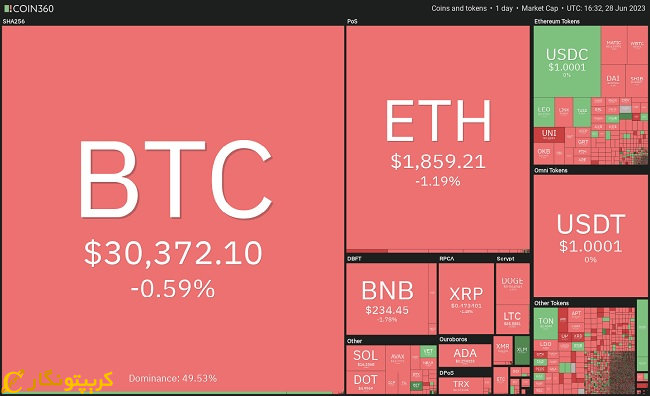
Now the question arises, will Bitcoin and altcoins break out of their overhead resistance levels or start a short-term correction??
Bitcoin price
Buyers tried to push Bitcoin above the $31,000 resistance on June 27, but the bears did not react. This kept the price of Bitcoin in the range between $31,000 and $29,500.

Bears will likely try to push the price below the $29,500 level, but bulls will protect this level. A rise in the 20-day exponential moving average (EMA) as well as the relative strength index (RSI) indicate a move in an upward direction.
If buyers push the price above $31,000, the BTC/USDT pair will resume its upward trend. Bears will try to stop the upside move at $32,400. But this upward trend will continue with the support of buyers.
But if the buyers fail to sustain this level and the price falls below $29,500, the BTC/USDT pair will be stuck between $24,800 and $31,000.
ether price
Trading between $1,926 and $1,861 on June 26 turned to the downside. The bulls returned the price to the range on June 27, but could not hold on to the higher levels.
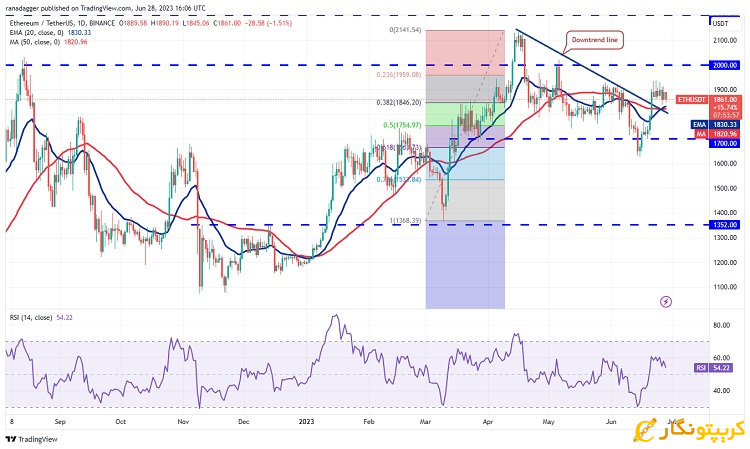
Bears are trying to push the price below the moving average. You should be very careful with this level because if this level is broken, the price will drop to $1700.
But if the bulls defend this level by themselves, the price will return to the moving average and start an upward movement. Then the bulls will try again to move towards $1937. If they break this level, the ETH/USDT pair will rise to the level of 2000 and then $2142.
Dogecoin price
On June 26, DOGE COIN broke below its 20-day moving average ($0.07). This suggests that the bears are strongly defending the resistance above $0.07.
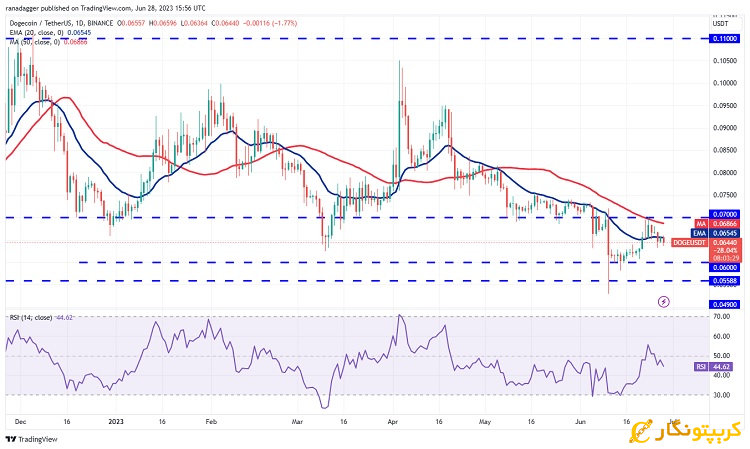
Although the bulls are trying to push the price above the 20-day moving average, the bears held their ground. Next, the DOGE/USDT pair will fall towards the $0.06 support. These factors suggest that the pair will fluctuate between $0.06 and $0.07 for some time.
Buyers need to challenge the $0.07 barrier to initiate the next phase of the climb towards $0.08 and then $0.1.
XRP price
XRP closed below the 50-day simple moving average (SMA) of $0.48 on June 26. This suggests that the bulls failed in their attempt to rally above the June 27 high.

The 20-day EMA and RSI in negative territory indicate that the bears have the upper hand. This caused the XRP/USDT pair to decrease first to $0.44 and then to $.041.
If the price crosses the current level and the 20-day moving average, this view will be invalidated in the short term. This opens the door for a rally towards $0.53 and then $0.56.
Source: cointelegraph.com